¶ Creating the first application
Pyplan is an integrated development environment for building analytical applications, designed so that we can model even without prior programming experience. Instead of writing all the logic in a single script, we build the calculation and data‑processing flow by dragging different types of nodes onto an influence diagram and connecting them visually.
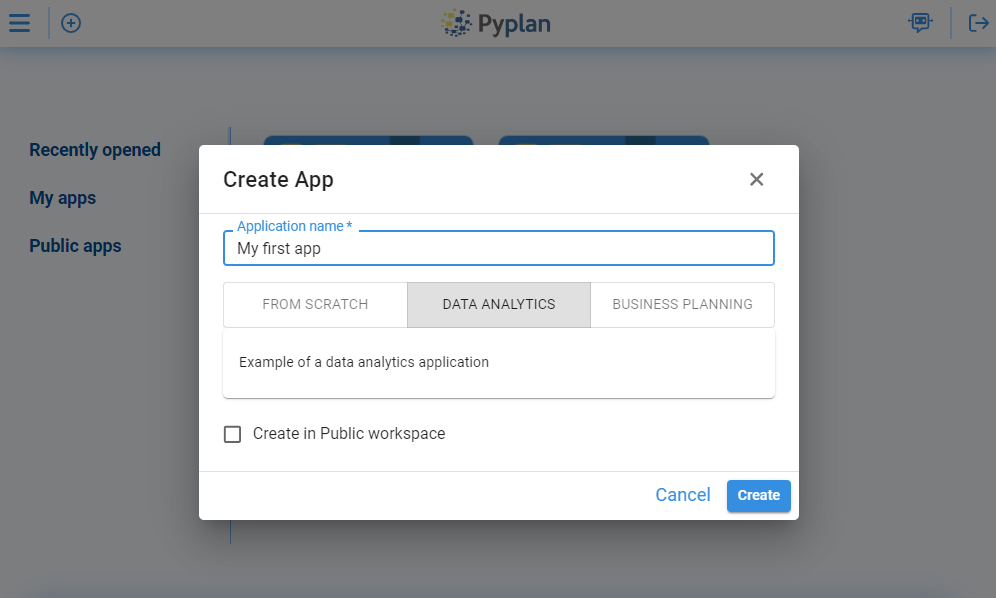
When we click Create an application, Pyplan opens a dialog where we can choose whether to:
- Start from scratch, with an empty application, or
- Start from an example, using a prebuilt model as a template (Data Analytics or Business Planinng)
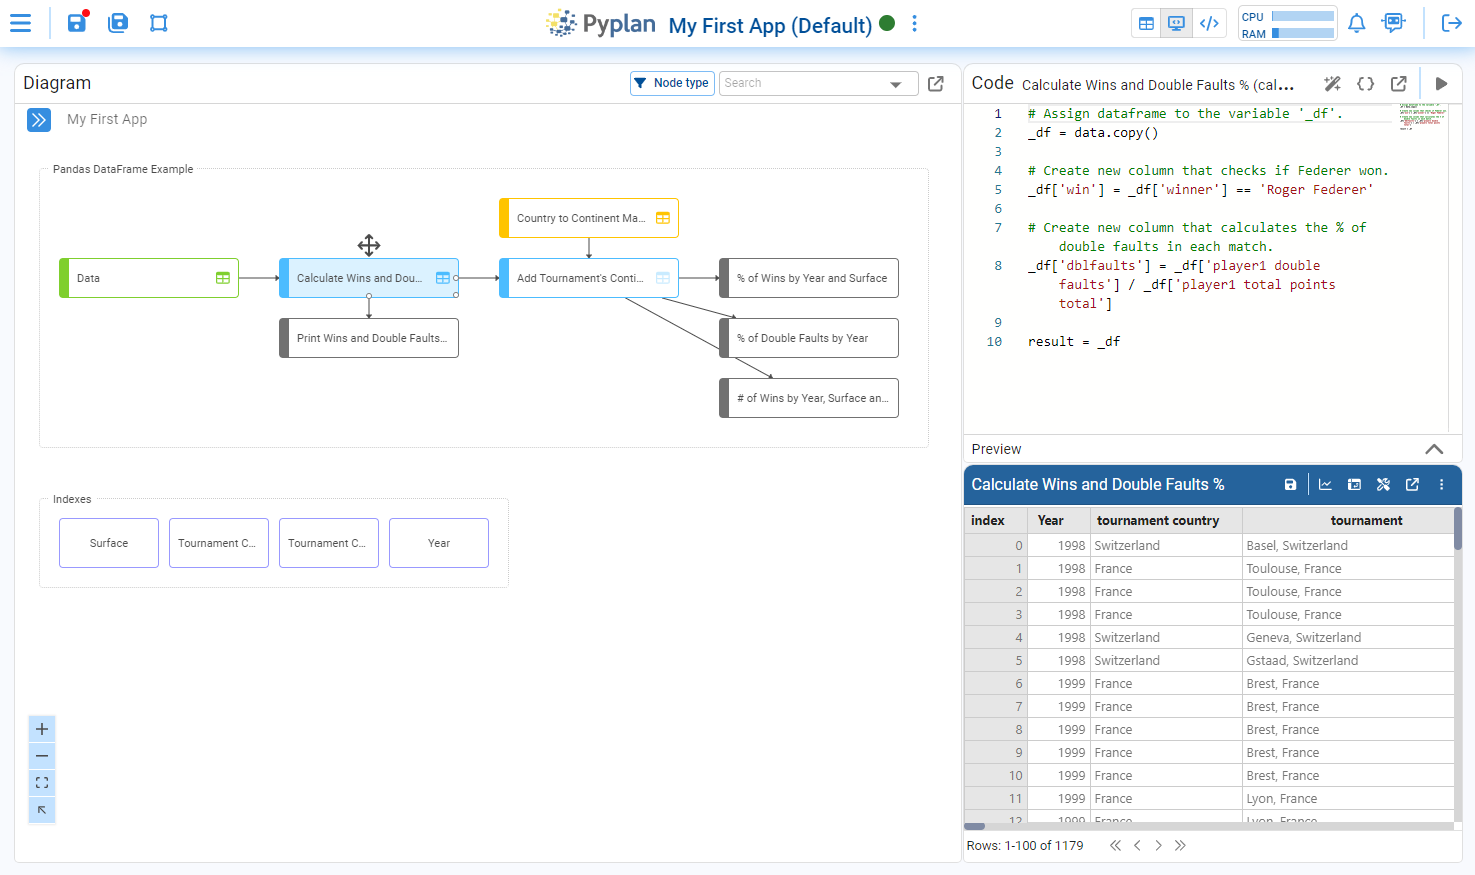
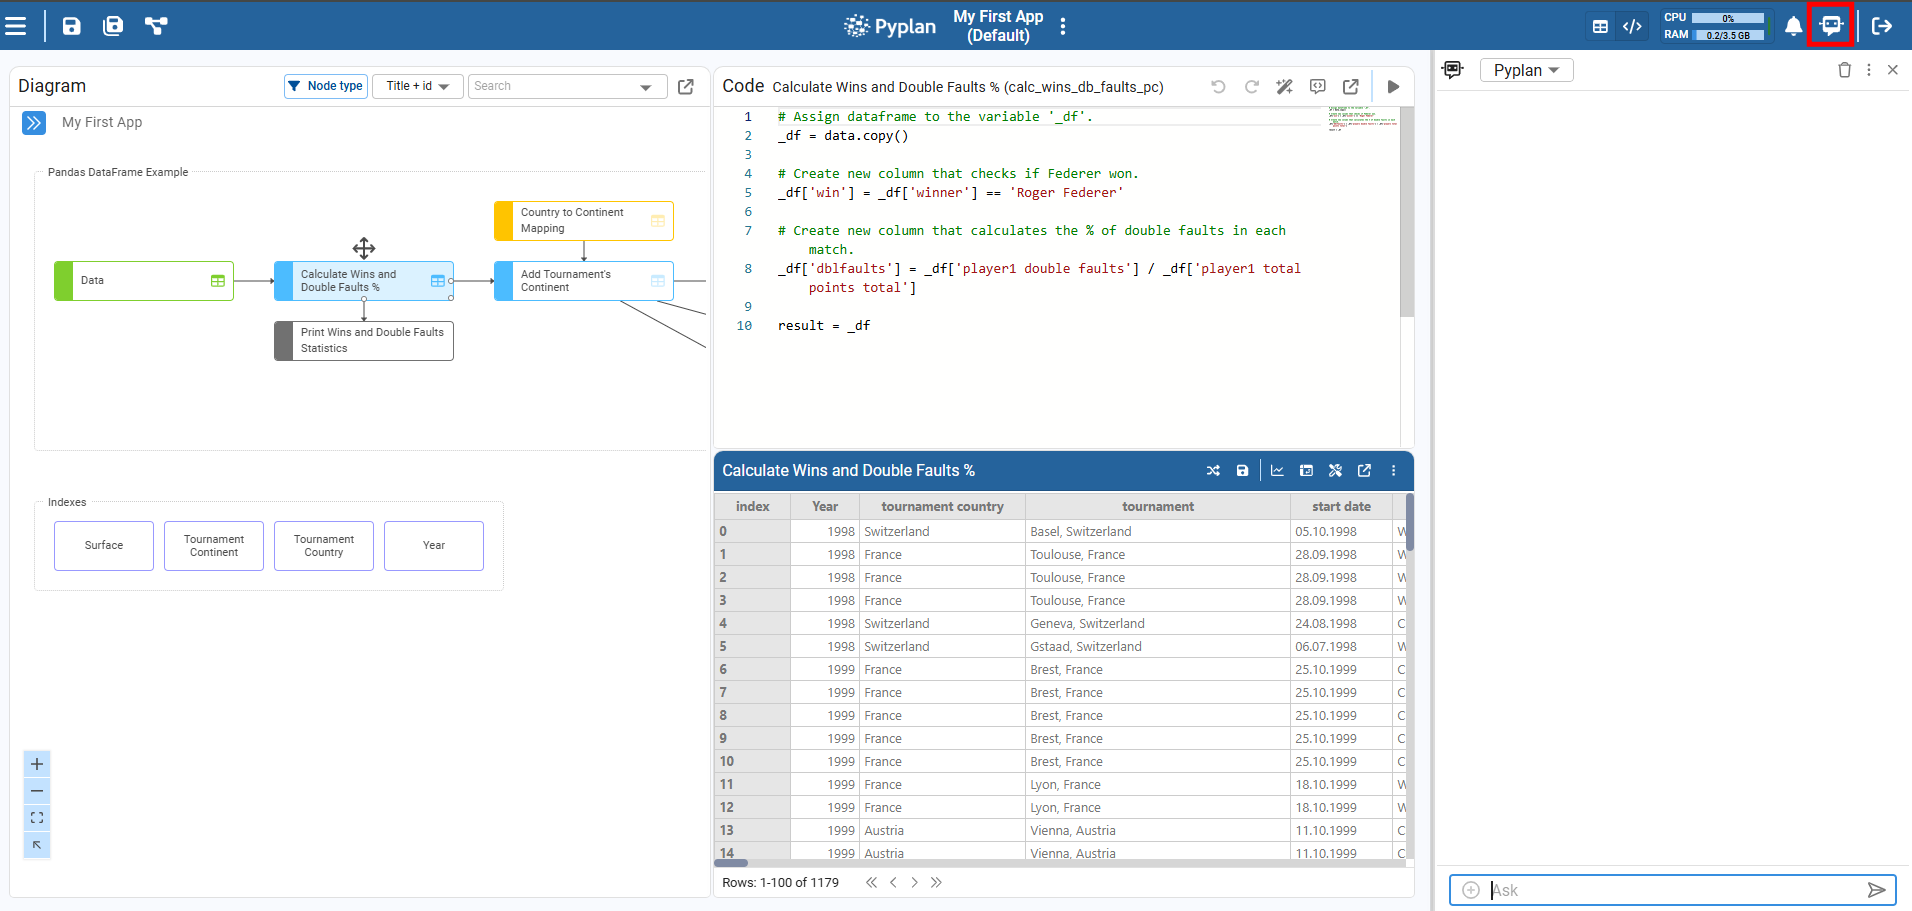
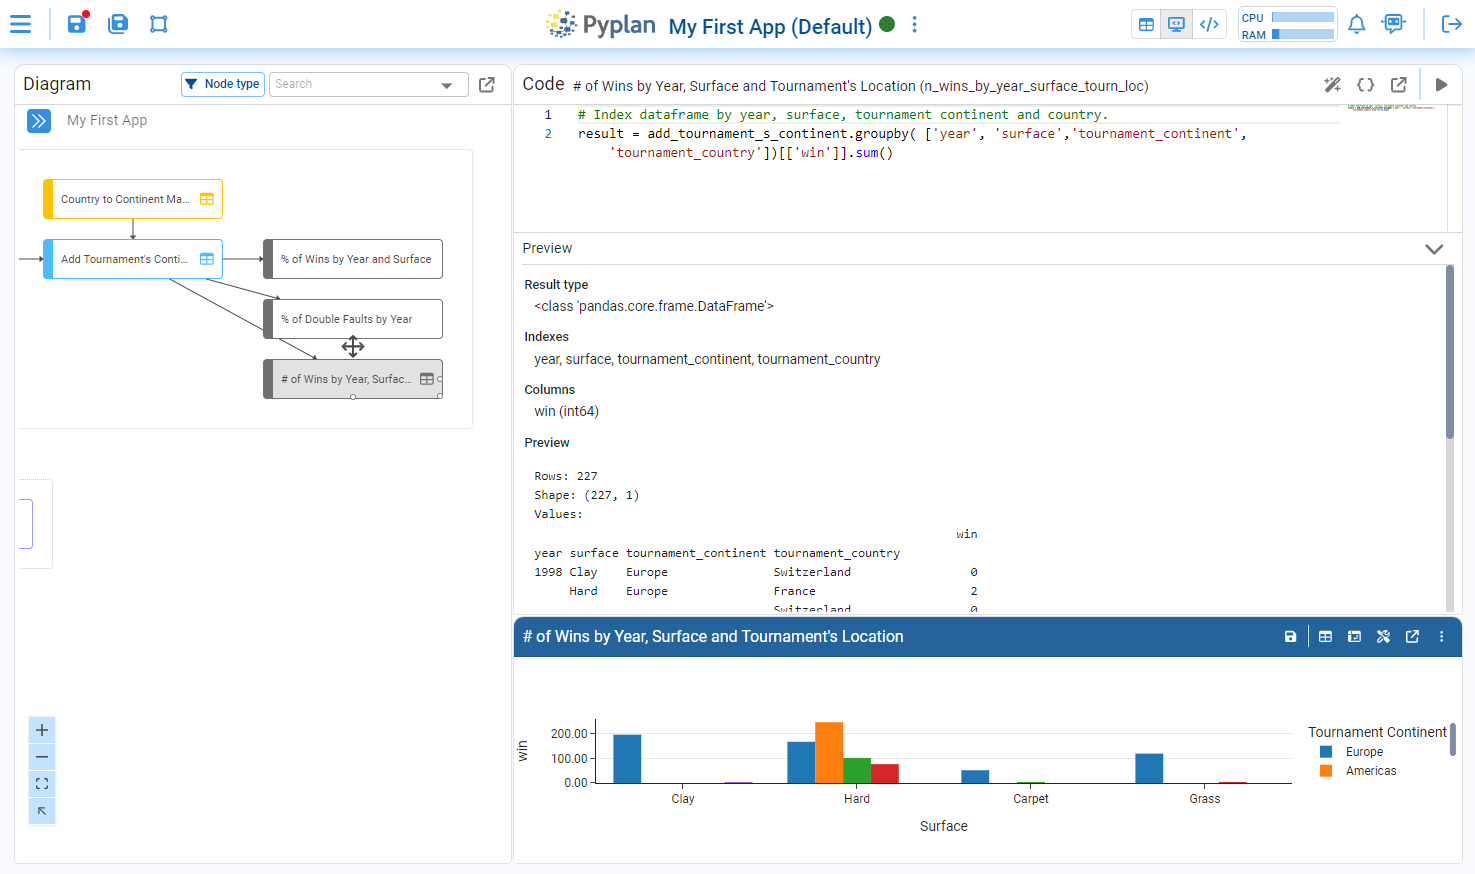
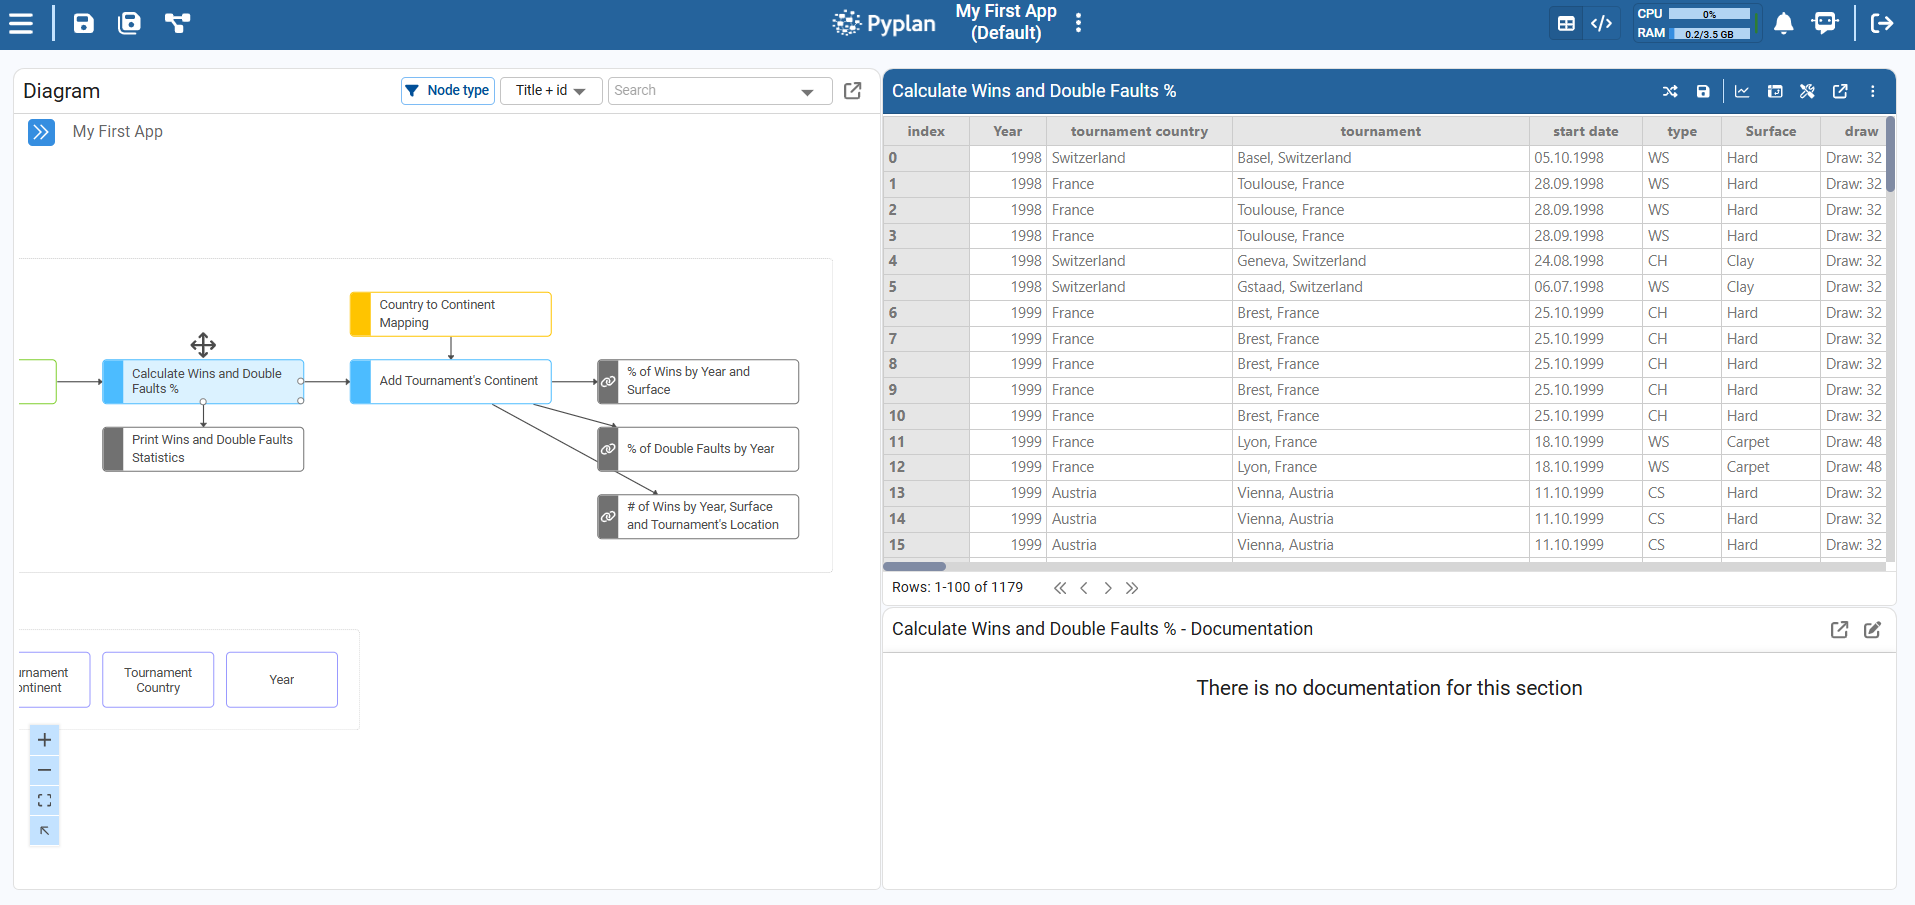
By choosing to create a data analysis application and then selecting the code visualization, you will reach a window like the following:
¶ Elements of the coding window
Once we click the Code icon in the main menu, we access the application’s influence diagram and its coding window.
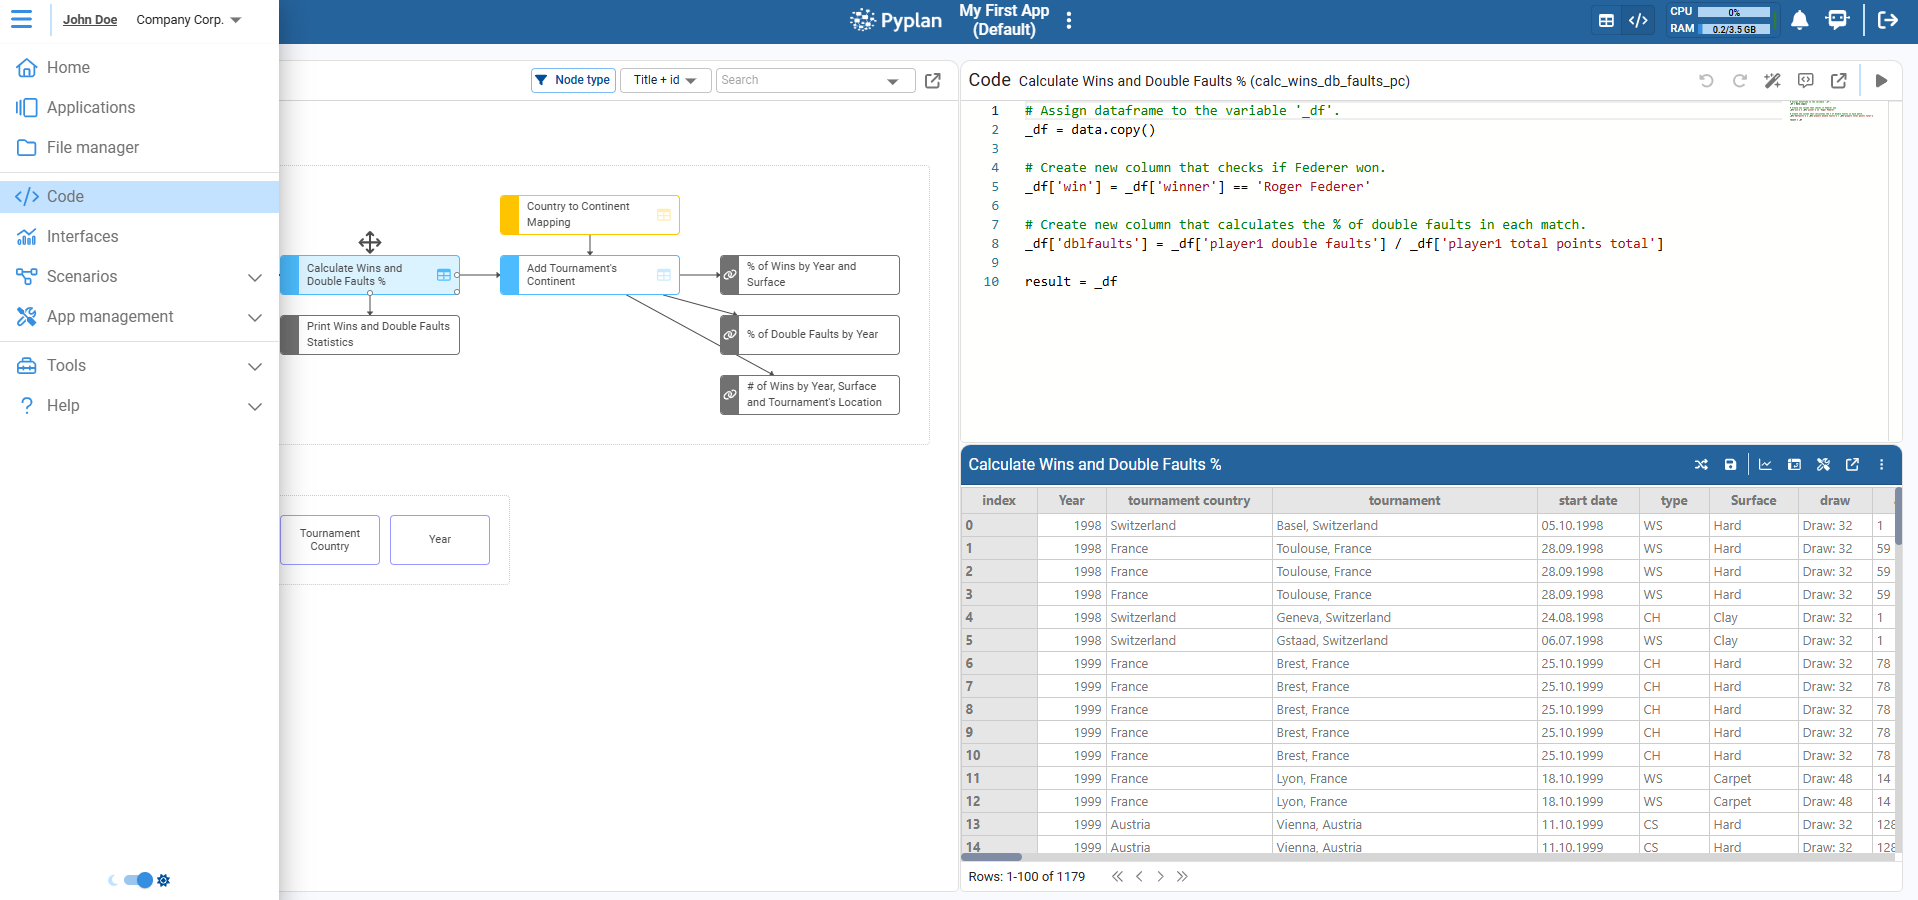
The main elements of this area are:
¶ Influence diagram
Visual representation of the application logic. Each node corresponds to a step in the data flow (loading, transformation, calculation, output), and the arrows show dependencies between nodes. From here we can select nodes, open their coding window, and run them.
¶ Node display modes
Controls that define how the selected node is shown on the right side:
- Result: result widget at the top and documentation at the botton.
- Code + Result: coding window at the top and result at the bottom.
¶ Assistant bot
Assistant that interprets natural language questions about Pyplan. We can ask how to use features, shortcuts, or best practices directly from the modeling environment, without leaving the app.
¶ Navigation shortcuts
Quick links in the top bar:
- Clicking the Pyplan logo takes us to Pyplan Home.
- Clicking the application name opens the Application Home (overview of the current app).
These shortcuts make it easy to move between the model we are editing and the rest of the platform.
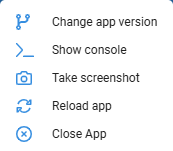
¶ App menu
The ellipsis menu to the right of the app title opens the App menu, where we can:
- Change the app version.
- Open the console.
- Take a screenshot of the current view.
- Reload the application.
- Close the application.
¶ Top‑left code toolbar
The icons on the top‑left (next to the hamburger menu) provide quick actions related to the current app and diagram, such as saving, switching view/layout, or accessing additional modeling tools (depending on configuration).
Save
- Saves teh current application.
¶ Save as
Opens a menu with options such as:
- Save as new version: creates a new version of the current application.
- Save application in my workspace: saves a copy of the app in My workspace.
- Save application in my team: saves a copy of the app in a Team workspace.
¶ Scenarios toolbar
Opens a menu with:
- Save scenario: saves the current state of inputs/assumptions as a named scenario.
- Select scenarios: lets us choose one or more previously saved scenarios to compare or reuse.
- We use this icon to manage what‑if scenarios within the same application.
¶ Node‑level toolbar
In the top‑right of the coding area we find controls specific to the selected node, for example:
- Run the node.
- Undo/redo changes in the code.
- Expand the coding window.
- Open node tools (e.g., wizards or additional views).
These controls let us edit and execute the node’s logic without leaving the coding window.
Together, these elements turn the coding window into the central workspace where we design the influence diagram, write and run Python code, inspect results, and navigate the whole application.
¶ Influence Diagram
It is the graphical representation of the calculation process. Each node represents a calculation step in the data transformation process. A node is selected by clicking on it. By double-clicking on a node, it is calculated. Its result is displayed in full screen according to your default display settings. Links (arrows) between nodes are automatically generated when invoking a node within the definition of another node.
¶ Features of a Node
A node is the smallest building block of the calculation process. To add a node, we drag the desired node type onto the diagram.
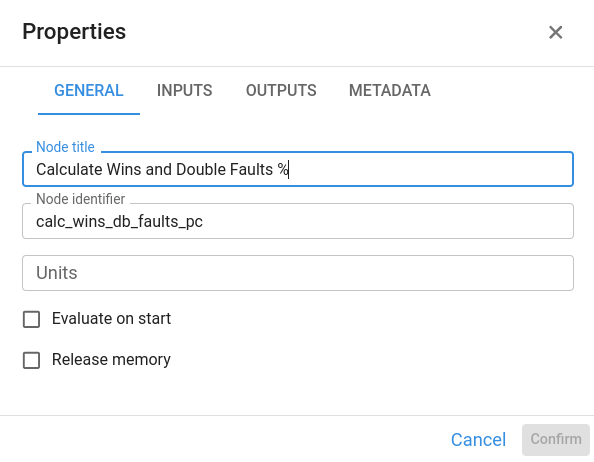
Each node has the following properties:
¶ Node title
Text displayed inside the node on the diagram. It should briefly describe the purpose of the node (for example, “Company Demand” or “Revenue”).
¶ Node Id
Unique identifier of the node, used to reference it from the Definition of other nodes.
- The Id is generated automatically from the title.
- We can edit it manually when we want a shorter or more meaningful identifier.
When writing code in the coding window, we use this Id to invoke the node.
¶ Unit
When a node represents a single measure, we can specify its unit (for example, USD, tons, %, hours). The unit appears in parentheses next to the title when the node’s result is displayed.
Units are for display only. They do not affect calculations and are not used in any automatic unit conversion.
¶ Evaluate on start
When enabled, the node is evaluated automatically when the application is opened. This is useful for key inputs or summary nodes that we want to have ready before the user starts interacting with the model.
¶ Release memory
When enabled, the node’s result is not kept in RAM after evaluation. This helps free memory for intermediate nodes whose results are only needed once in the calculation chain.
- If another node later requires its result, the node will be recalculated.
- We typically use this option for heavy intermediate steps that are not directly viewed by users.
¶ Definition
The Definition is the transformation executed when the node is evaluated.
- It is written in Python in the node’s coding window.
- The code must end by assigning the final value to the variable
result, for example:result = _df
Pyplan evaluates this code when we run the node and stores the value of result as the node’s output.
¶ Preview
Technical description of the node output. The Preview summarizes the structure of the result (for example, dimensions of an array, columns of a DataFrame, or basic metadata) and is useful to quickly understand what the node returns without inspecting the full Result view.
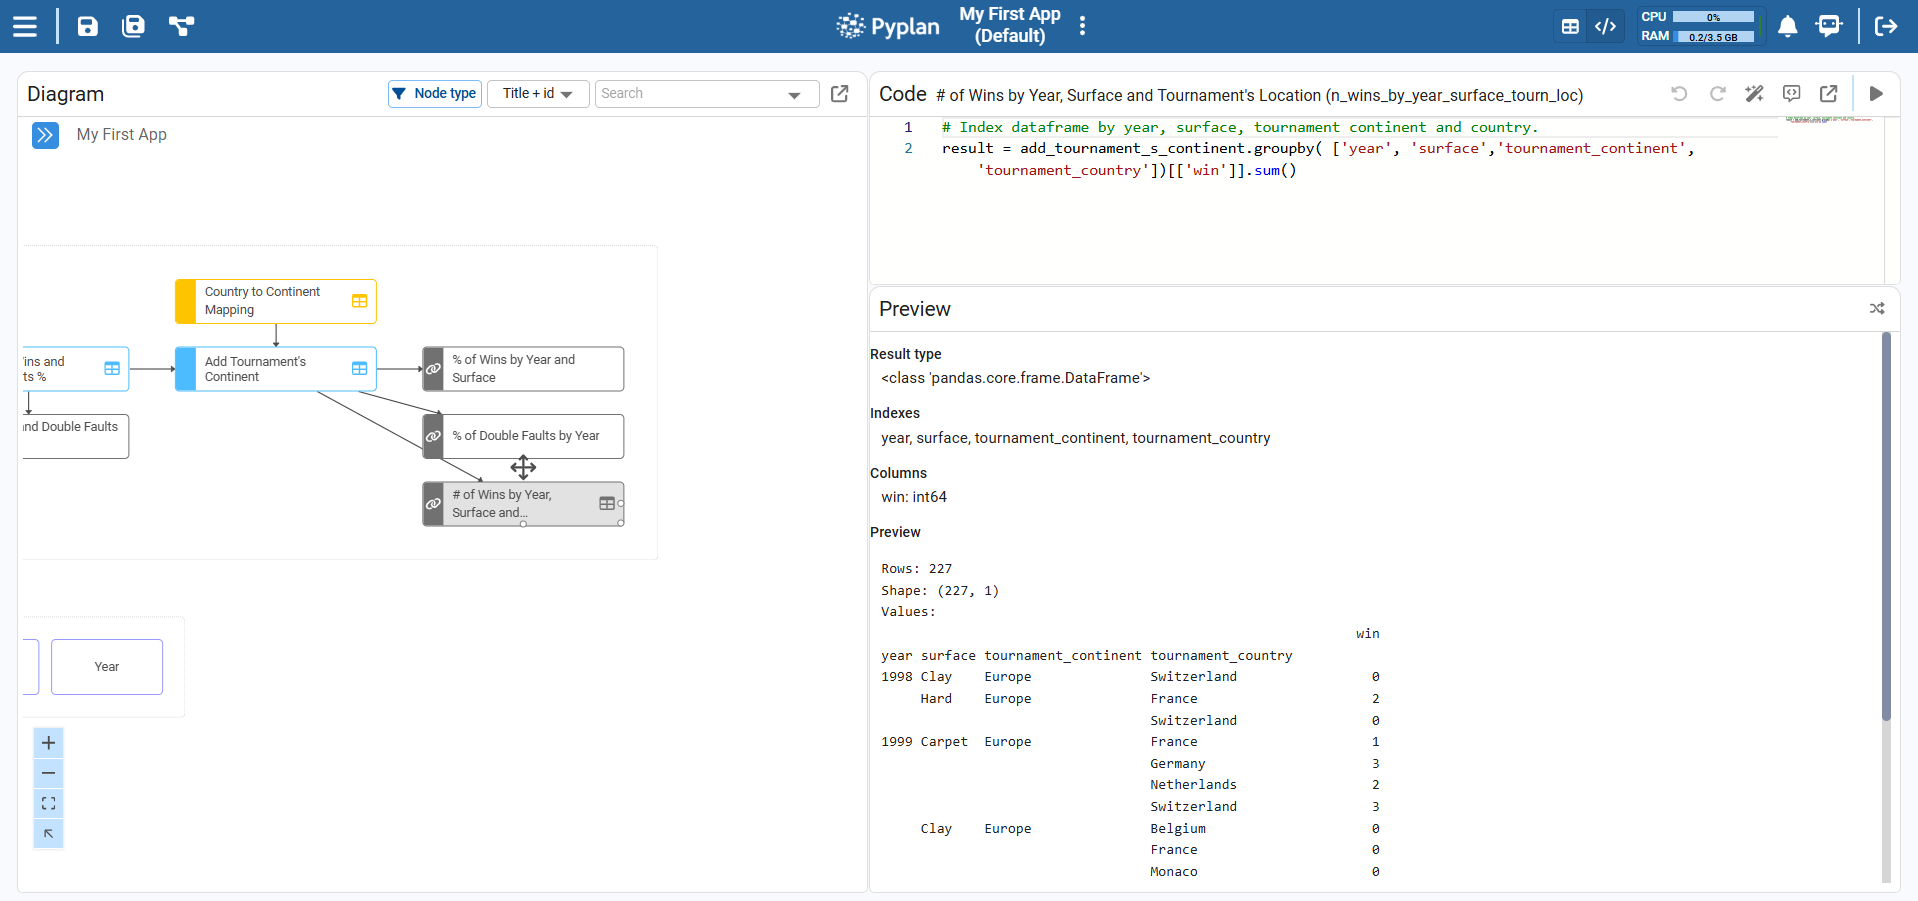
¶ Result
The Result is the output of executing the Definition code.
When the result is a type understood by Pyplan (for example, a pandas DataFrame, a NumPy array, or an xarray object with dimensions), Pyplan can display it:
- In table format.
- As charts or other visualizations, depending on the interface.
From the Result view we can explore data, apply quick filters, and connect the node to interfaces.
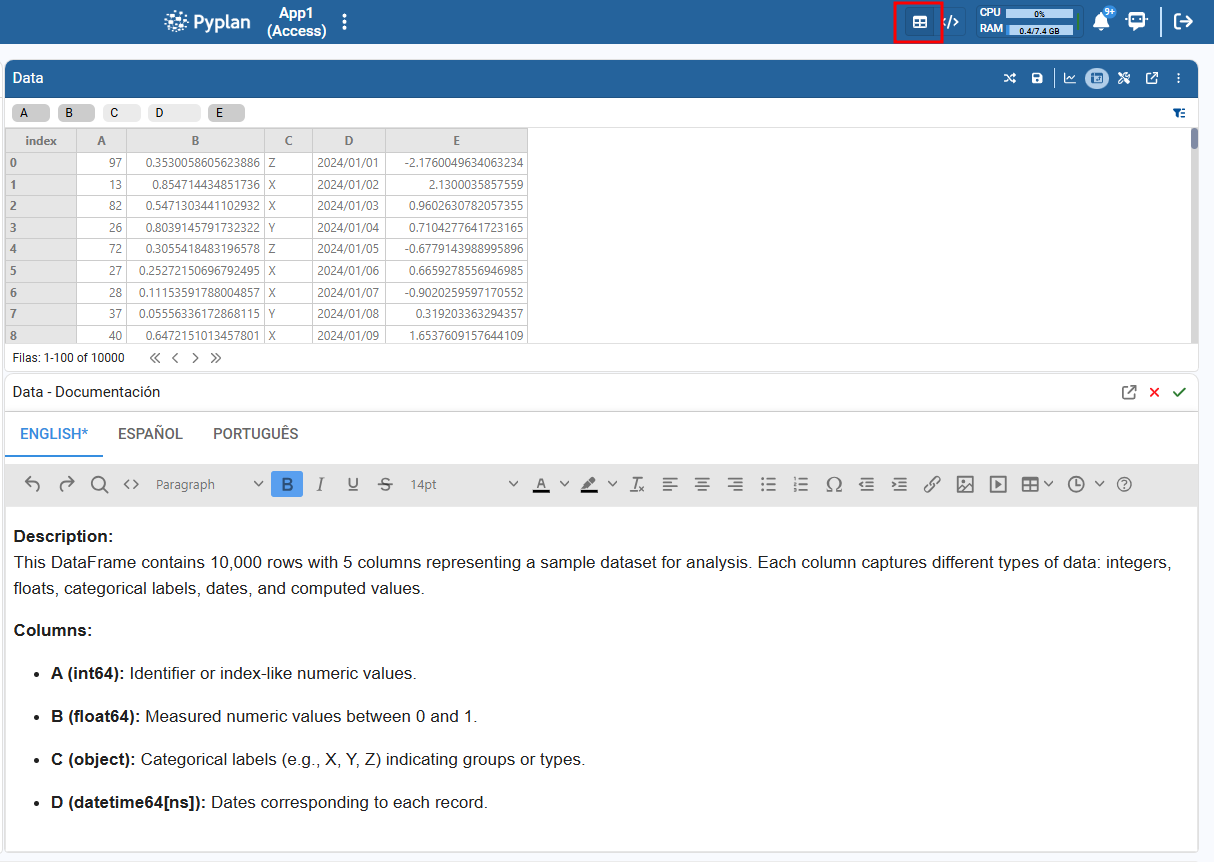
¶ Documentation
Documentation is the text that conceptually explains what a node does and how it fits into the calculation flow. It is shown at the bottom of the Result view for that node.
To add documentation to a node in Pyplan:
- Open the node you want to document from the influence diagram.
- In the top‑right corner of the node panel, select the Result view.
- In this view, the documentation panel becomes available at the bottom.
- Enter any descriptions, explanations, assumptions, or notes that help understand the purpose of the node.
- Save the changes manually using the save button in the documentation panel.
This documentation is then visible to anyone who opens the node’s result, making the model easier to read and maintain.
¶ Html Templates
HTML Templates allow us to save and reuse custom HTML content across our applications. Instead of writing the same HTML structure from scratch every time, we can define a template once and use it as a starting point whenever we need it.
Create a html template
To create a new HTML Template, we first need to have the HTML editor open with the desired content.
- Open the HTML editor and write or edit the content we want to save as a template.
- Once the content is ready, click the Save Template icon in the toolbar.
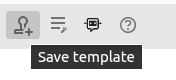
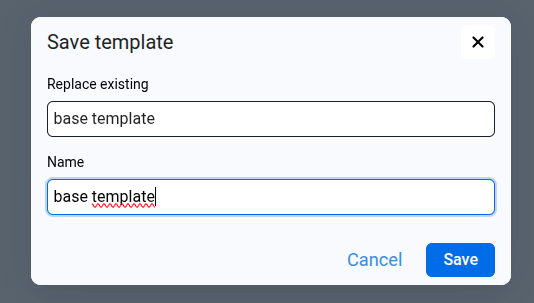
- A dialog will appear similar to the following
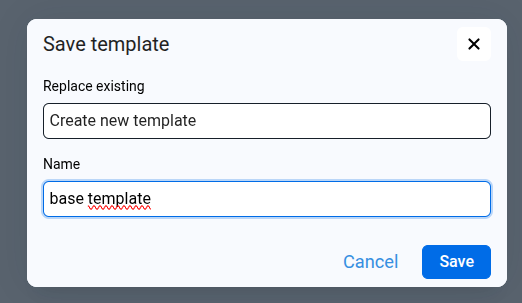
- In the Replace existing selector, choose Create new template.
- In the field below, enter the desired name for the new template.
- Click Save.
The template is now saved and available for future use.
Use a template
We can load an existing template into the HTML editor as a starting point for new content.
- Open the HTML editor for the interface or node we want to configure.
- In the toolbar, click the Insert Template icon.
- The Insert template dialog will open.
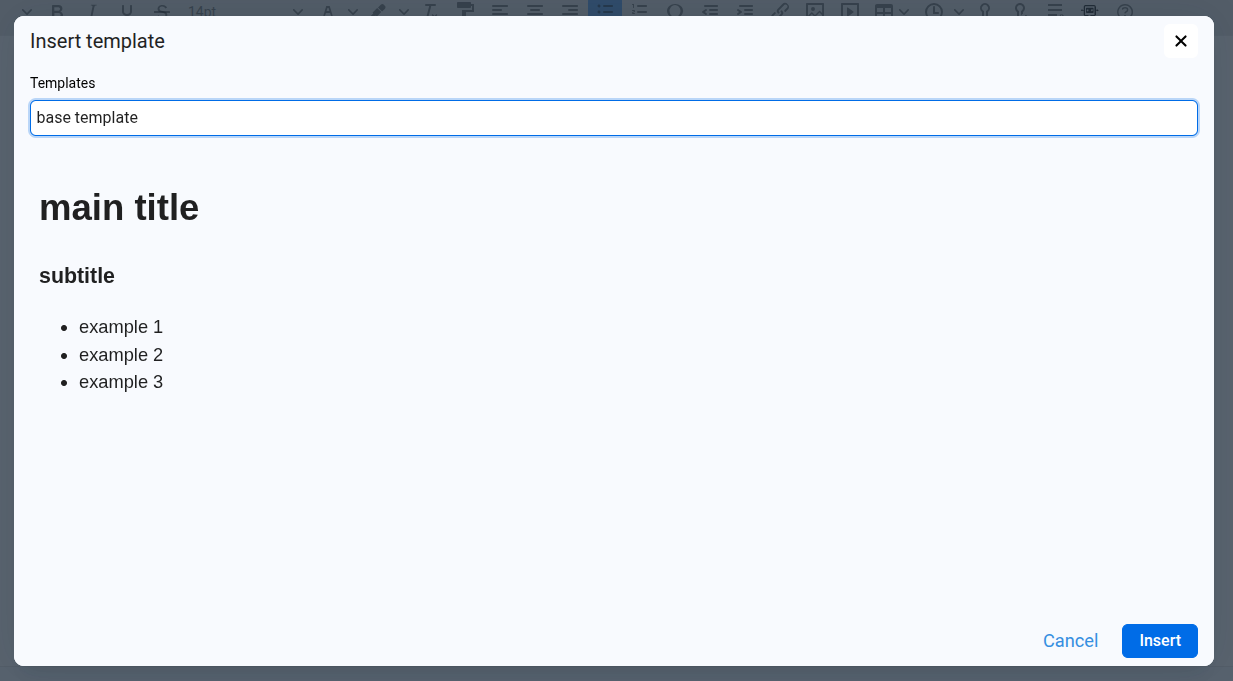
- In the Templates selector, choose the template we want to use. A preview of its content will be displayed below.
- Click Insert to load the template into the editor, or Cancel to close the dialog without changes.
The editor will be populated with the template's HTML content, which we can then freely modify without affecting the original template.
Update an existing template
If we want to overwrite an existing template with new content:
- Edit the HTML content we want to use as the updated template.
- Click the Save Template icon in the toolbar.
- In the dialog, open the Replace existing selector and choose the template we want to overwrite.
- Click Save to confirm.
Note: This action will permanently replace the previous content of the selected template.
Rename a template
- To rename an existing template, click the Rename or delete templates icon in the toolbar.
- The Manage templates dialog will open.
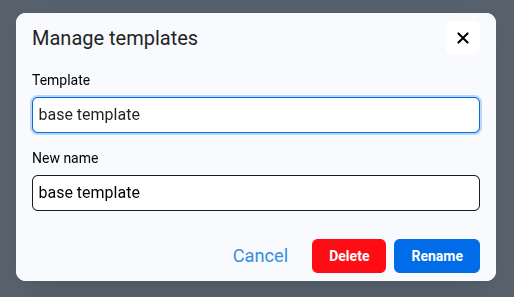
- In the Template selector, choose the template we want to rename.
- In the New name field, enter the desired name.
- Click Rename to apply the change, or Cancel to close without saving.
Delete a template
To delete an existing template, click the Rename or delete templates icon in the toolbar.
- The Manage templates dialog will open.
- In the Template selector, choose the template we want to delete.
- Click Delete to permanently remove it, or Cancel to close without changes.
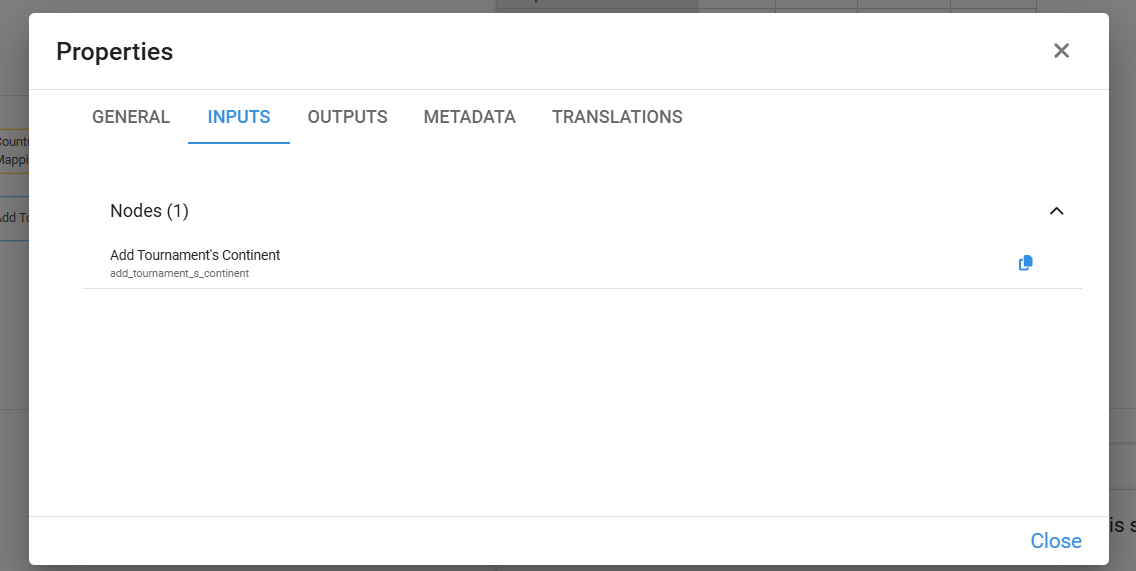
¶ Inputs
The Inputs list shows all nodes referenced in the Definition of the selected node. These are the direct predecessors in the calculation flow.
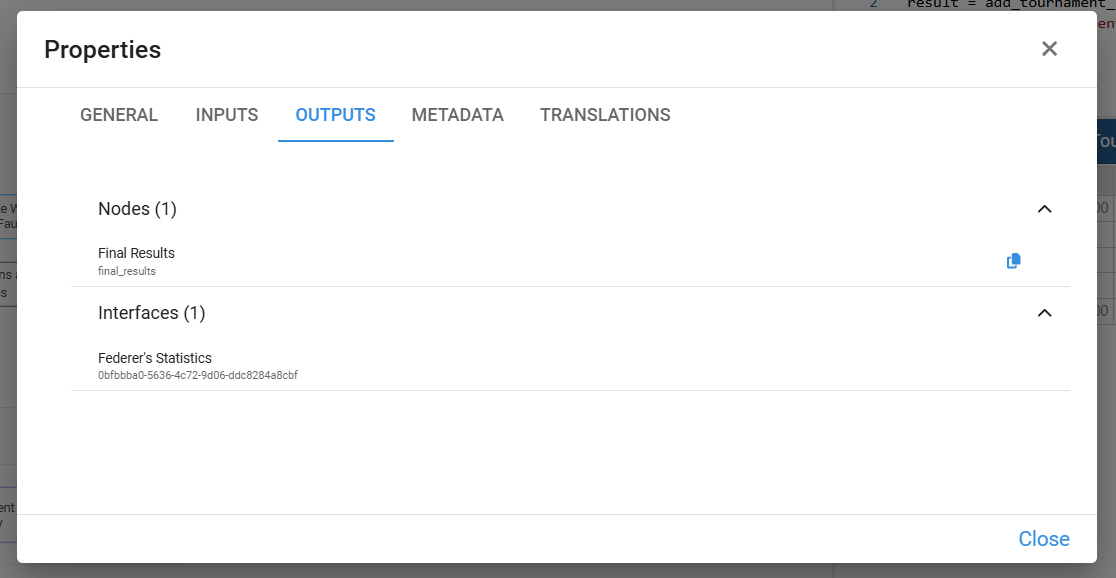
¶ Outputs
The Outputs list shows:
- All nodes that use the result of the selected node in their own Definition (its direct successors in the calculation flow).
- All interfaces where the selected node is used (for example, as a data source for a table, chart, or control).
This makes it easy to see both the downstream calculations and the user interfaces that depend on the node.
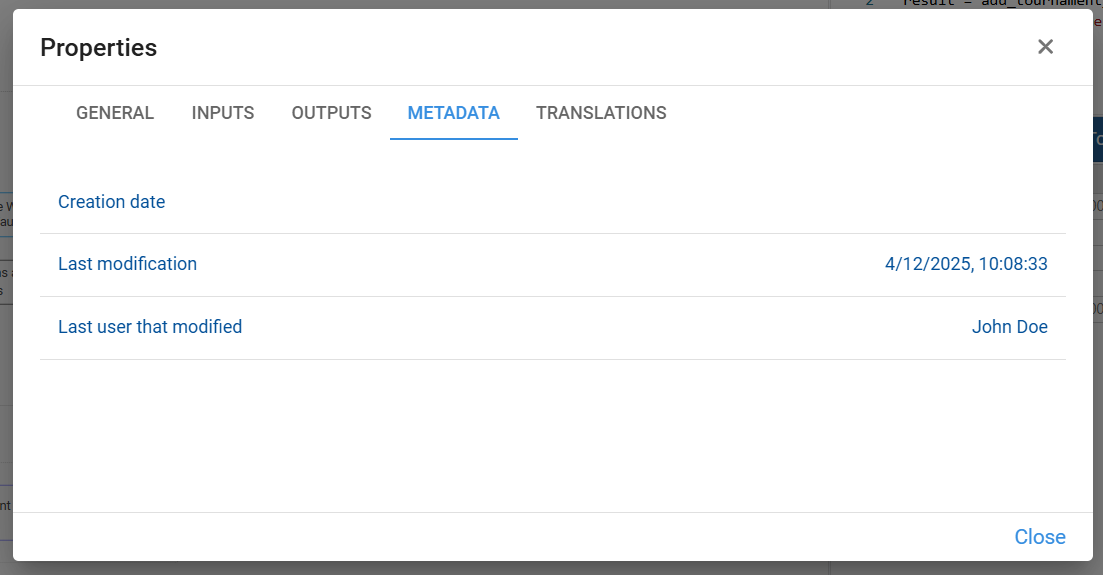
¶ Metadata
The Metadata tab shows basic audit information for the selected node:
- Creation date – when the node was originally created.
- Last modification – date and time of the most recent change.
- Last user that modified – the user who made the last change.
This information helps us understand the history of the node and track who updated it and when, which is especially useful in collaborative models.
¶ Translations
The Translations tab lets us define the node title in multiple languages.
For each available language we can specify:
- Language – the language of the translation (for example, Español, English, Português).
- Node title – how the node title should appear in that language.
Pyplan uses these translations when the application is viewed in different interface languages, so users see node titles in their preferred language.
You can access all of these properties by right-clicking on the node and then clicking on properties.
¶ Node types
In Pyplan we use different node types for different purposes. Each type is designed to simplify the definition of the parameters needed for its execution and to make the influence diagram easier to read.
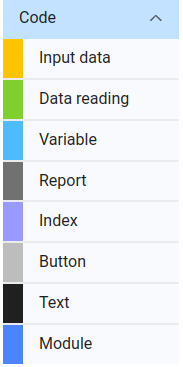
¶ Variable
Variable nodes are the most common node type. They contain generic calculation logic written in Python.
- By default, Variable nodes are blue.
- If a Variable node has no outputs, its color changes to gray and it is treated as a report node (a terminal result in the flow).
- If a Variable node has outputs in modules outside the one it belongs to, it turns red, indicating that it is used across module boundaries.
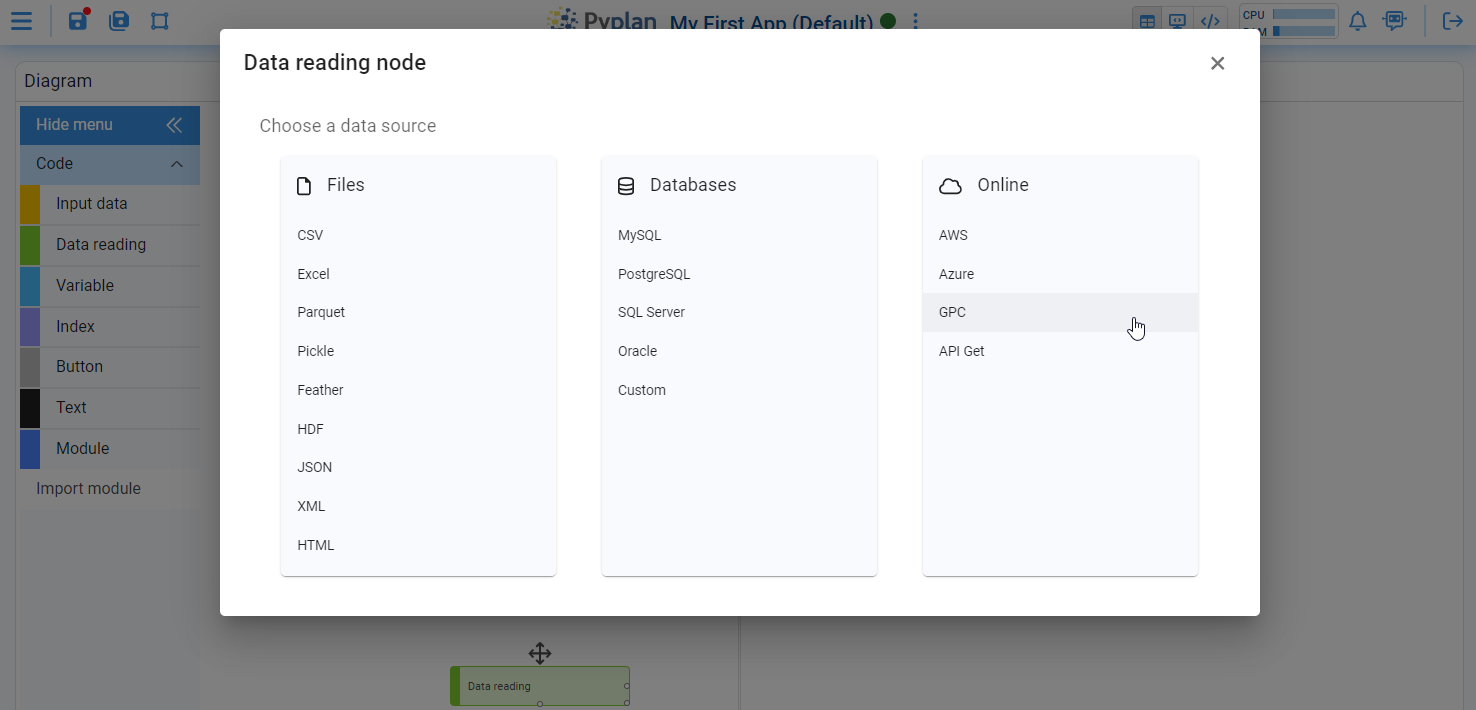
¶ Data reading
Data reading nodes are used to connect the model to external data sources.
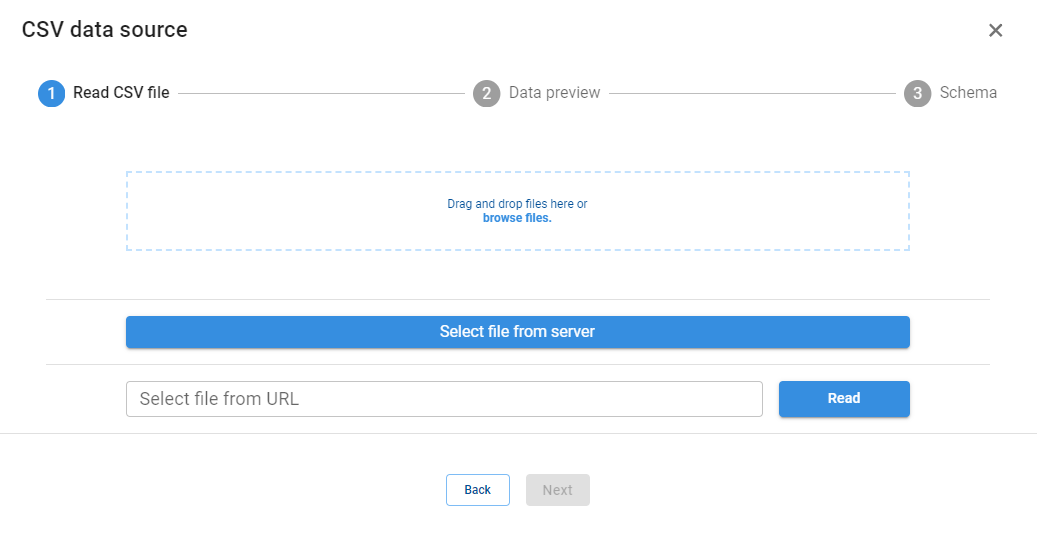
- When we drag a Data reading node onto the diagram, Pyplan opens a wizard that guides us through the connection to supported sources (files, databases, etc.).
- The wizard helps us configure connection parameters and load the data into the application as a structured result (for example, a DataFrame or xarray object).
¶ Input data
Input data nodes let us create manual data‑entry processes that can later be used in calculations.

After choosing the type of input, Pyplan opens a configuration wizard. The main options are:
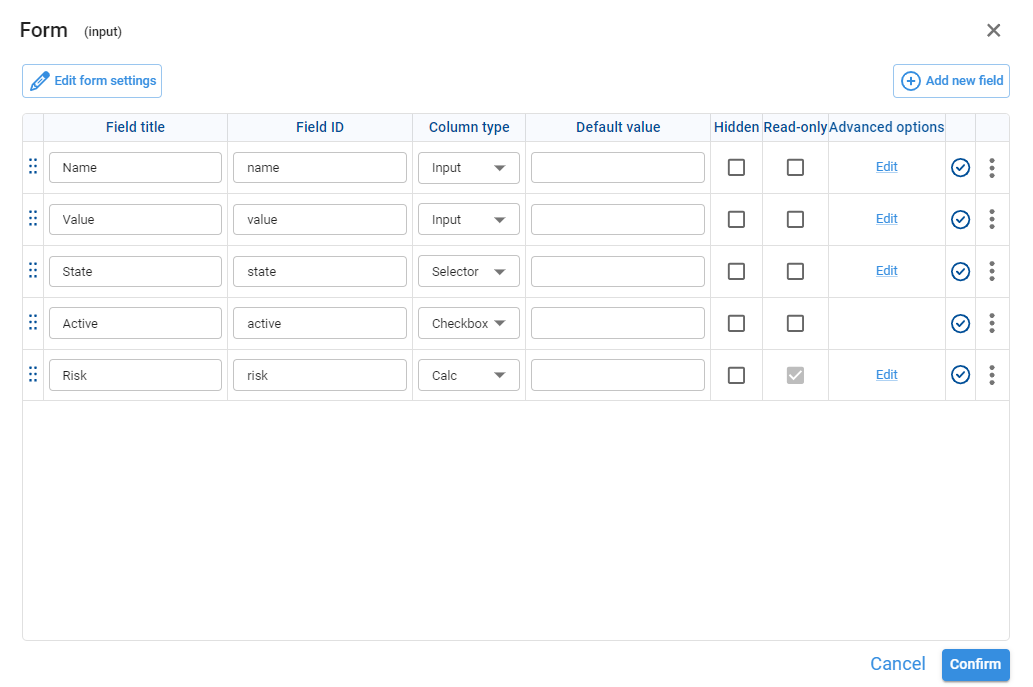
¶ Form
A Form input allows us to design a simple screen where users can type or select values (for example, assumptions, parameters, or configuration options). These values are then stored and used by other nodes.
¶ Cube
An InputCube node allows entering data in a multidimensional way, similar to working with a pivot table. Values entered in the cube are stored in a configurable database defined in the same wizard.
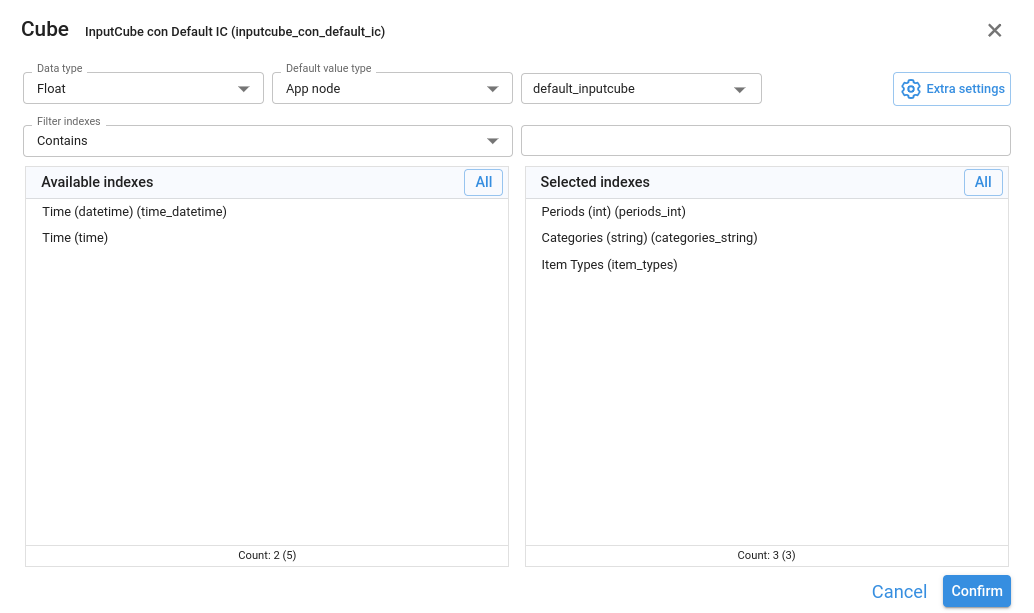
The initial configuration includes:
Data type
Type of values the node accepts (for example, number, text). All inputs must comply with this type.
Default value type
- Scalar: default value is a literal (for example,
0,1,'empty'). - App node: default value comes from another node in the application.
Default value (optional)
- If Scalar, this field accepts atomic values that match the chosen data type.
- If App node, this field points to the identifier (or title) of the node providing the default value. That node can return:
- A scalar, or
- An xarray DataArray. In this case, the wizard includes a node finder to select it by Id or title.
Available indexes / Selected indexes
Here we choose which Index‑type nodes will define the dimensions of the cube (for example, Product, Region, Year). Selected indexes become the axes of the input table.
The extra settings you can configure are the following:
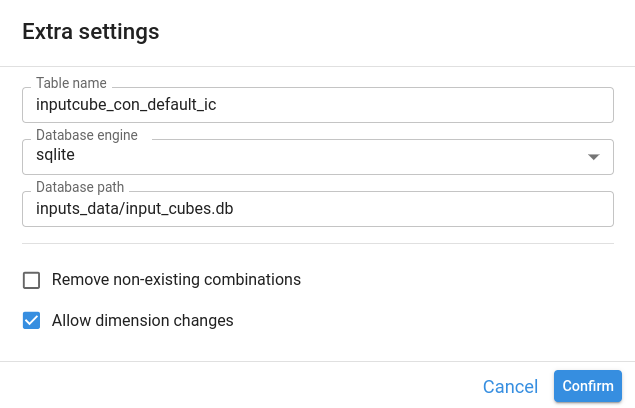
Table name
Name of the table stored in the database. By default, it is the same as the node identifier.
Database engine
Engine used to store cube data. Options are:
sqlitepostgresqlcustom
Database parameters
Connection parameters required by the chosen engine (for example, file path, server, database name, user, and password).
Remove non‑existing combinations
If enabled, any stored combination of dimension members that no longer exists in the current indexes is removed.
Example: if the Categories index changes from ["Category A", "Category B"] to ["Category B", "Category C"], all records with "Category A" are deleted when this option is checked.
Allow dimension changes
- If unchecked, adding or removing a dimension after the table has been created raises an error.
- If checked, dimension changes are allowed according to the previous options.
Important considerations
To access the underlying xarray DataArray of an InputCube node, we must use its .value property in the Definition, for example:
result = sales_data.value¶ Report
A Report node lets us build a report from a list of concepts (items), assigning to each concept either a fixed value or the result of another node.
The Items from index checkbox controls how we define that list of concepts:
- Checked → the concepts come from an Index node.
- Unchecked → we define the list of concepts manually.
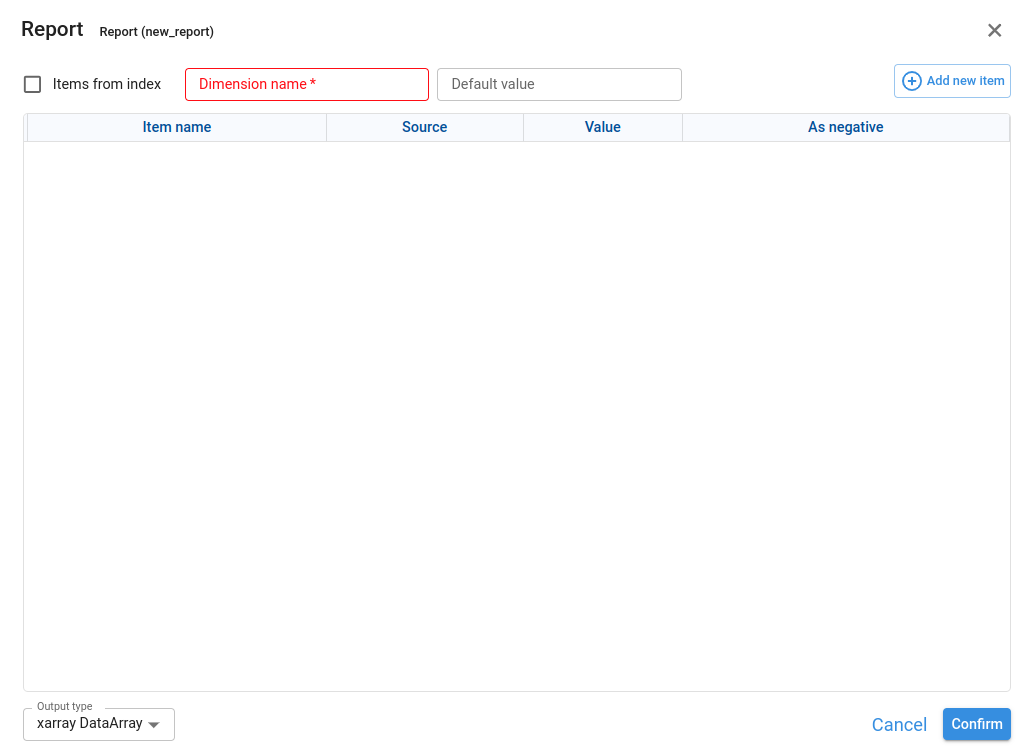
¶ Case 1 – Items from index unchecked (manual list)
When Items from index is unchecked, we configure:
Dimension name
Name of the dimension that will be created in the report. Its members are the concepts we define (for example, Account, Cost type, KPI).
Default value (optional)
Value used for any concept that has no explicit value or node assigned.
In this mode we manage the concepts manually:
- Add new concepts with Add new item.
- Reorder them (move up/down).
- Edit or delete existing concepts.
¶ Case 2 – Items from index checked (concepts from an Index node)
When Items from index is checked, the dialog changes and we configure:
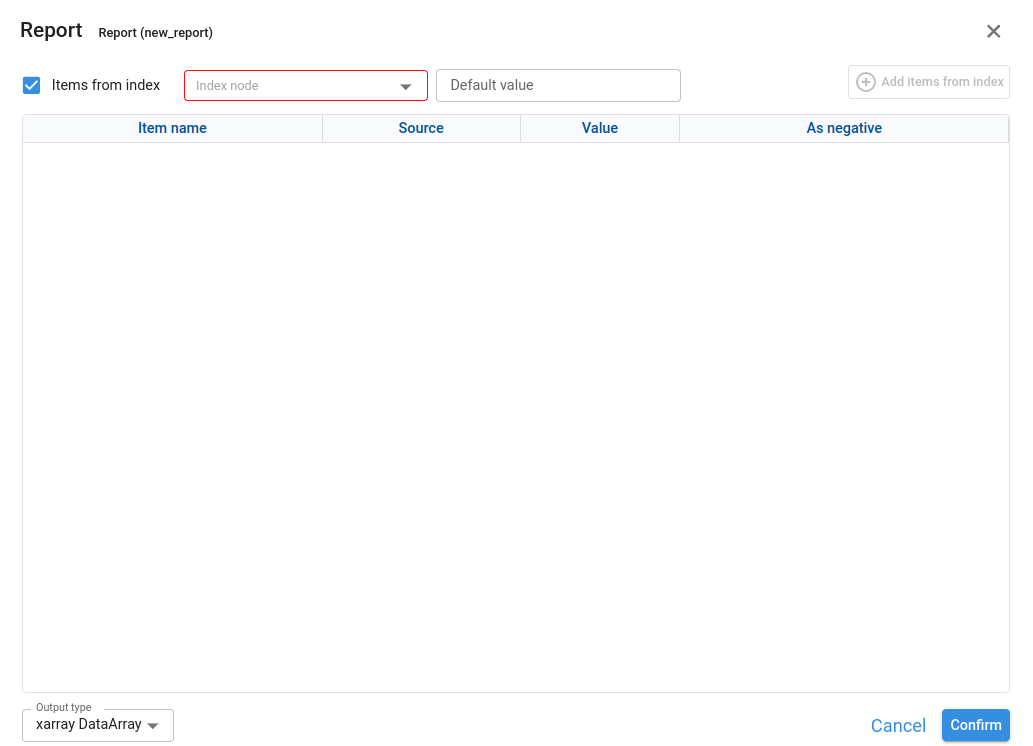
Index node
Identifier of a node of type Index whose result is a pandas.Index. We select it using a node finder by Id or title.
Default value (optional)
Default value for concepts that do not have a specific value or node assigned.
After selecting the Index node, we can generate all concepts in that index automatically with Add items from index. The concepts will then appear in the list and we can configure their details.
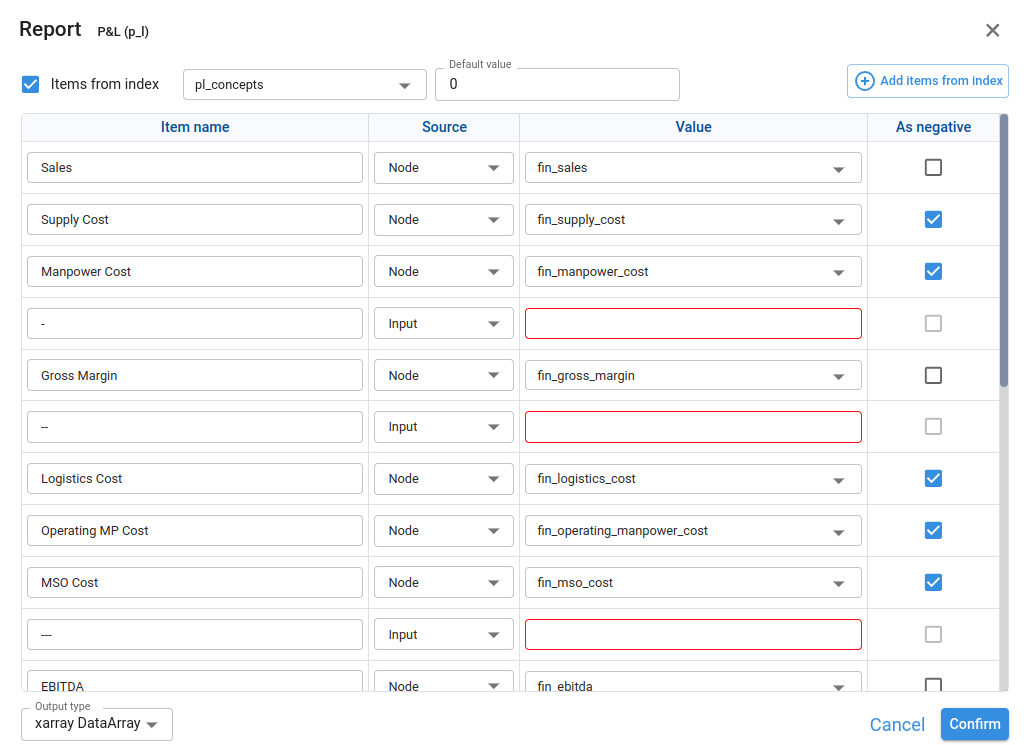
For each concept in the report we define:
Item name
Name of the concept (for example, Sales, COGS, EBITDA).
Source
- Input: the concept uses a scalar value entered directly in the Value field.
- Node: the concept uses the result of another node.
Value
- If Source = Input, this is a scalar value that the report will show for that concept.
- If Source = Node, this is the Id (or title) of the node that provides the values for that concept. The field is a node finder.
As negative
When enabled (only available if Source = Node), the result of the concept is multiplied by -1 in the report.
This is useful when the underlying node stores positive values but we want to present them as negative in the report.
Example: in a Profit & Loss statement, we may keep COGS as positive in the model but display it as negative compared to Sales.
¶ Output type
The Output type selector defines the format of the final report:
xarray DataArray
The result is an xarray.DataArray. The array includes all dimensions present in the xarray results of the nodes assigned to the concepts.
pandas DataFrame
The result is a pandas.DataFrame that concatenates (stacks) the data from all the DataFrame‑type nodes used in the report.
¶ Important considerations
If Output type = xarray DataArray, the report only supports concepts whose source nodes return:
xarray.DataArray, or- scalars.
If Output type = pandas DataFrame, the report only supports nodes whose result is:
pandas.DataFrame,pandas.Series, or- scalars.
When Items from index is checked, the concepts list in the report is linked to the index in the selected node
¶ Button
A Button node is a special node that executes Python code every time the user clicks it. It is typically used to trigger actions such as refreshing data, running scenarios, or updating interfaces. The result of a Button node does not persist in memory; its purpose is to perform actions, not to store data.
¶ Index
An Index node is how Pyplan defines and stores dimensions used across the calculation process (for example, Product, Region, Year). Its Definition returns a list of elements that constitute the dimension. These indexes are then referenced by other nodes (such as variables, InputCubes, or reports) and have a specific behavior when they are used in interfaces, where they define the axes or selectors for multidimensional data.
¶ Text
A Text node is a purely descriptive element in the influence diagram. It is used to add comments, titles, or explanations that make the diagram easier to read and understand. Text nodes do not participate in calculations and have no inputs or outputs.
¶ Module
A Module node is a container that can hold other nodes inside it. We use modules to organize complex calculations hierarchically, grouping related logic into sections or submodels.
- We enter a module by double‑clicking it.
- Modules can be nested without limit, allowing us to build multi‑level structures that keep large models manageable.
¶ Alias
An Alias node is a mirrored representation of another node, used to make influence diagrams clearer without duplicating logic.
- The Alias shows the same result as the original node.
- Editing the Definition in the Alias also changes the Definition of the original node, since both point to the same underlying logic.
- We create an Alias by selecting a node and pressing Ctrl+M (Command+M on Mac).
Aliases are especially useful when we want to show the same node in different parts of the diagram or modules to clarify dependencies and improve readability.
¶ Operations in the Influence Diagram
Navigation
The influence diagram is a hierarchical representation of the application’s calculation logic.
- To enter a module, we double‑click the module node.
- To go back up in the hierarchy, we use the navigation path (breadcrumb) shown above the diagram and click the level we want to return to.
This lets us move quickly between high‑level views and detailed sub‑models.
¶ Inspection of node properties
To inspect or edit the properties of a node:
- Select the node in the diagram.
- Right‑click it.
Pyplan opens the node properties window, where we can review and change items such as title, Id, Definition, documentation, inputs, and outputs.
¶ Drag nodes to the diagram
To create new nodes, we click the blue button in the upper‑left corner of the diagram to open the node palette. From there we:
- Choose a node type (Variable, Data reading, Input data, Index, etc.).
- Drag and drop the node onto the diagram.
This is the main way to add new calculation steps to the data‑processing flow.
We can also reuse and rearrange existing nodes:
- Copy:
Ctrl+C - Cut:
Ctrl+X - Paste:
Ctrl+V
To select multiple nodes:
- Click each node while holding Ctrl, or
- Hold Shift, click on an empty area of the diagram, and drag to draw a selection rectangle around the nodes.
¶ Results display
When we select a node, the result panel indicates whether the node is already calculated or not.
We can calculate (run) a node in three ways:
- Double‑click the node in the diagram.
- Click the Play icon in the result panel.
- Press Ctrl+Enter while the node is selected.
There are two main visualization modes for a node, selectable in the upper‑right area of the diagram window:

- Result + Documentation
Shows the node result together with its documentation, useful for reviewing outputs and their explanation. - Code + Result
Shows the node Definition (Python code) together with the result, allowing us to edit the code and immediately see the corresponding output.